“Visualization” Is the Key to Decarbonization — How to Start Energy DX
Terms like “decarbonization” and “energy digital transformation (DX)” are becoming more common in global discussions about sustainability.
But for many factories and offices, these goals can still feel distant — something only large corporations can afford to pursue.
In reality, though, every company can begin right where they are.
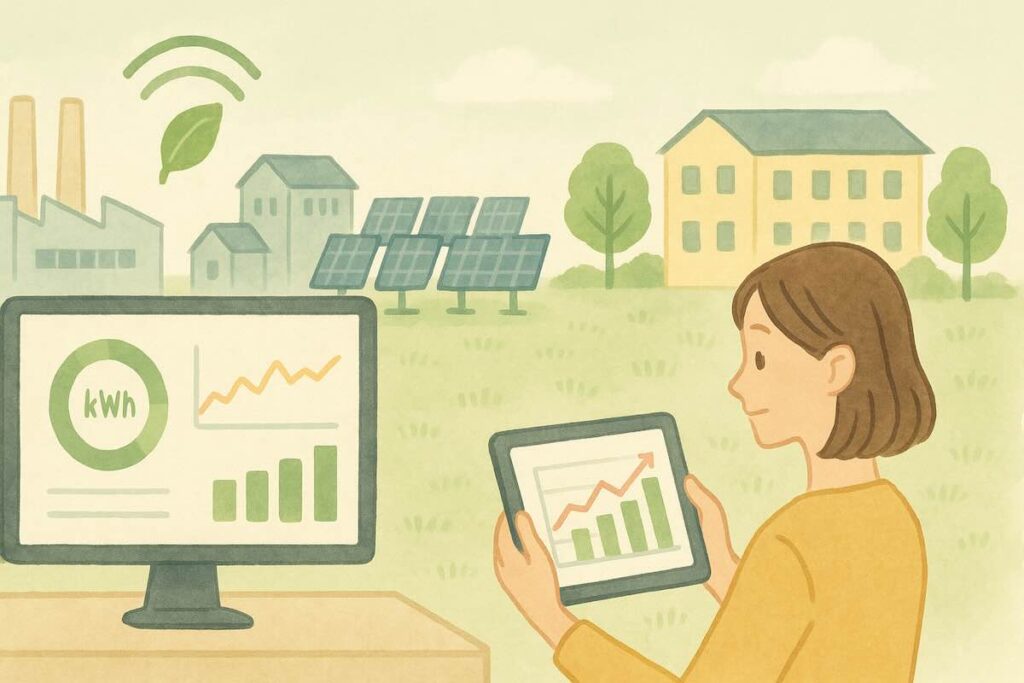
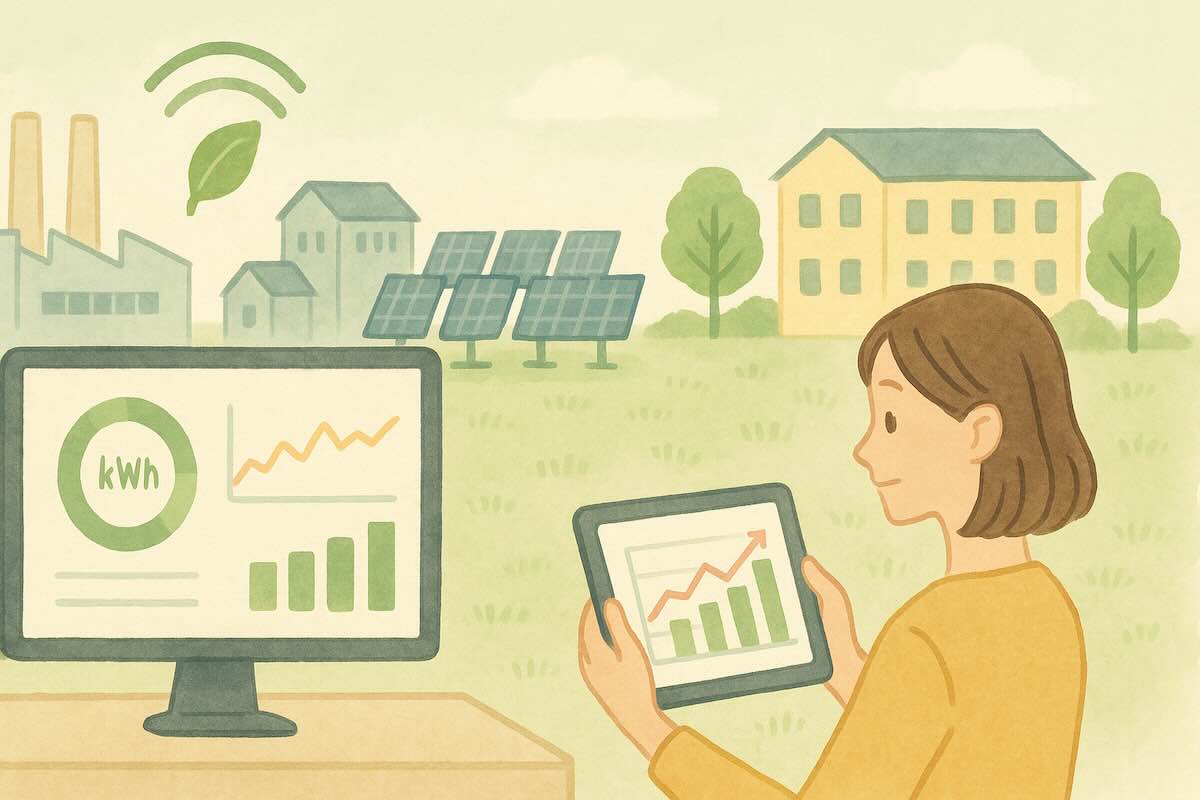
The first step is visualization — making energy usage visible through data.
Let’s explore how this simple yet powerful approach can start your journey toward a smarter, greener operation.
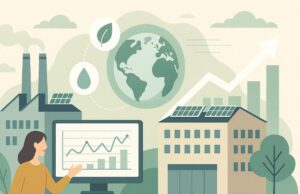
🌱 Decarbonization Starts with Awareness
Energy DX might sound like a complex process involving AI, IoT, and cloud systems.
But its essence is simple: use data to reduce waste.
By understanding where, when, and how much energy is being used, you can uncover inefficiencies that were previously invisible.
For instance, if you can monitor energy use by time of day, you might notice unexpected peaks in power consumption — perhaps when air conditioning or certain equipment is running unnecessarily.
Decarbonization doesn’t start with grand investments.
It begins with knowing the facts, not just relying on intuition.
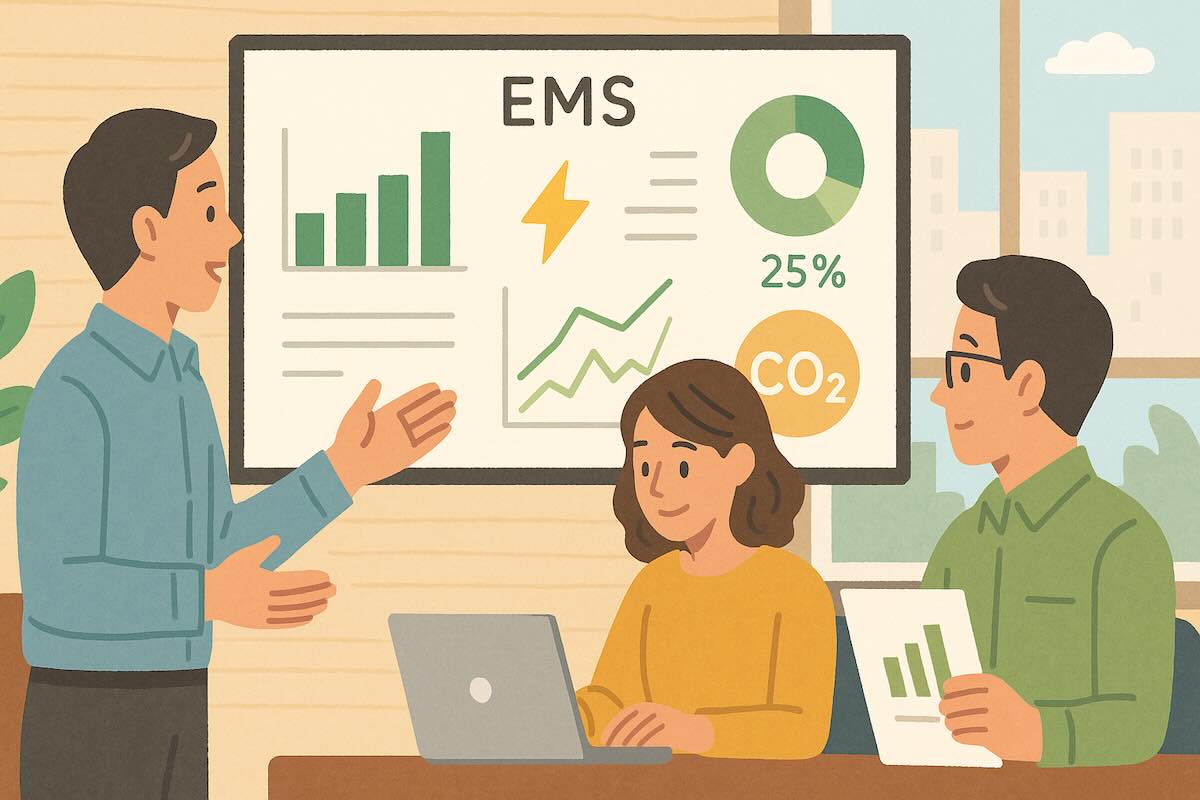
⚙️ How Visualization Drives Action
Once energy data becomes visible, people naturally begin to change their behavior.
Real-time dashboards showing electricity usage or equipment activity make inefficiencies clear — and once you see waste, it’s hard to ignore it.
Some companies have introduced IoT-based energy monitoring systems and found that even simple visibility led to greater awareness and teamwork around energy-saving practices.
When data is shared across departments, employees start to see energy efficiency as everyone’s responsibility, not just the facility manager’s.
Visualization, in this sense, is more than just numbers on a screen — it’s a tool for changing mindset and culture.
💡 Start Small and Build Gradually
The path to Energy DX doesn’t require large-scale systems from day one.
Start small — even a few sensors can make a difference.
Begin by tracking the electricity usage of key machines or by visualizing total daily consumption.
That alone can reveal which areas of your operation consume the most energy.
Small, continuous improvements are the foundation of digital transformation.
As more data accumulates, it becomes easier to move toward advanced analytics, AI-based predictions, or automated control systems.
Consistency matters more than scale.
💡 How Orange Box Supports Energy DX
At Orange Box Inc., we provide IoT and AI-based energy visualization solutions for factories and buildings.
Our systems collect real-time data on power and equipment performance and present it on a cloud dashboard that’s easy to understand and act upon.
Beyond visualization, our AI tools can detect anomalies and suggest optimal operation patterns.
We’ve designed our solutions to be flexible — suitable for small and medium-sized factories as well as large facilities — so that companies can start small and expand step by step.
Our goal is simple: to help organizations see their energy, understand it, and use it smarter.
👉 Orange Box: Smart Factory Solution
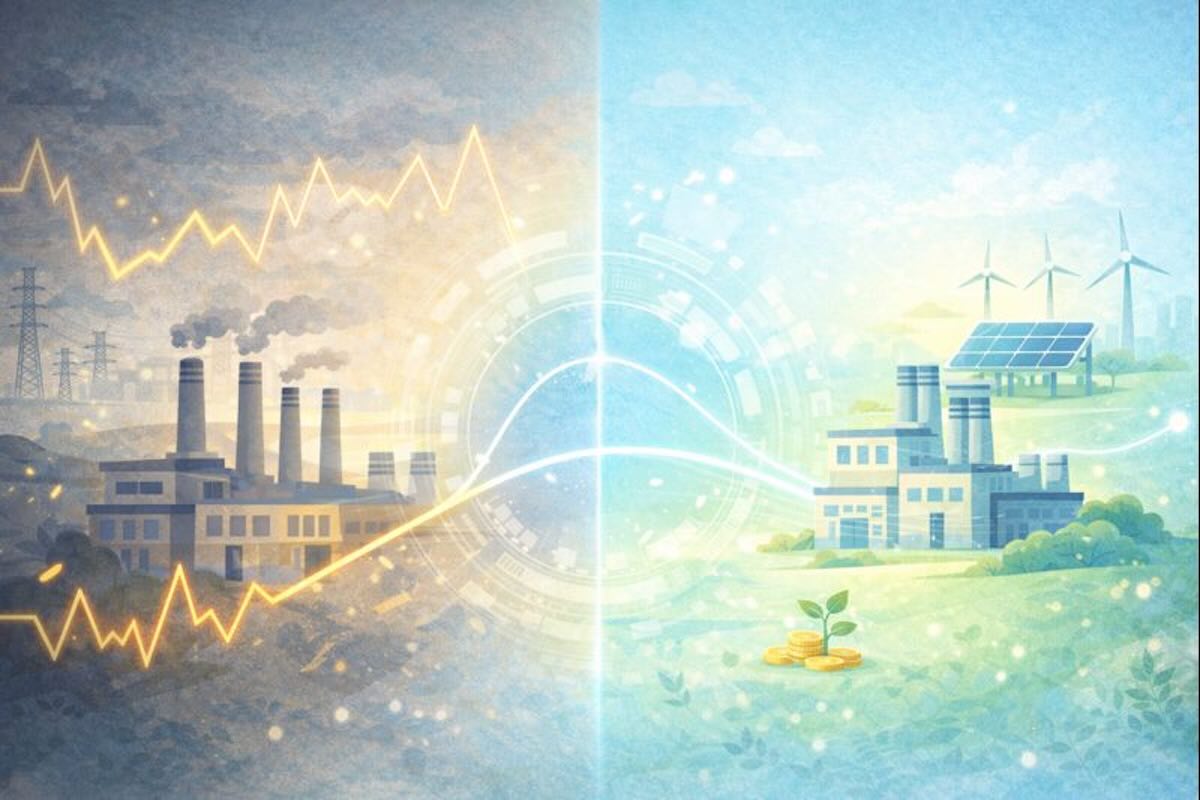
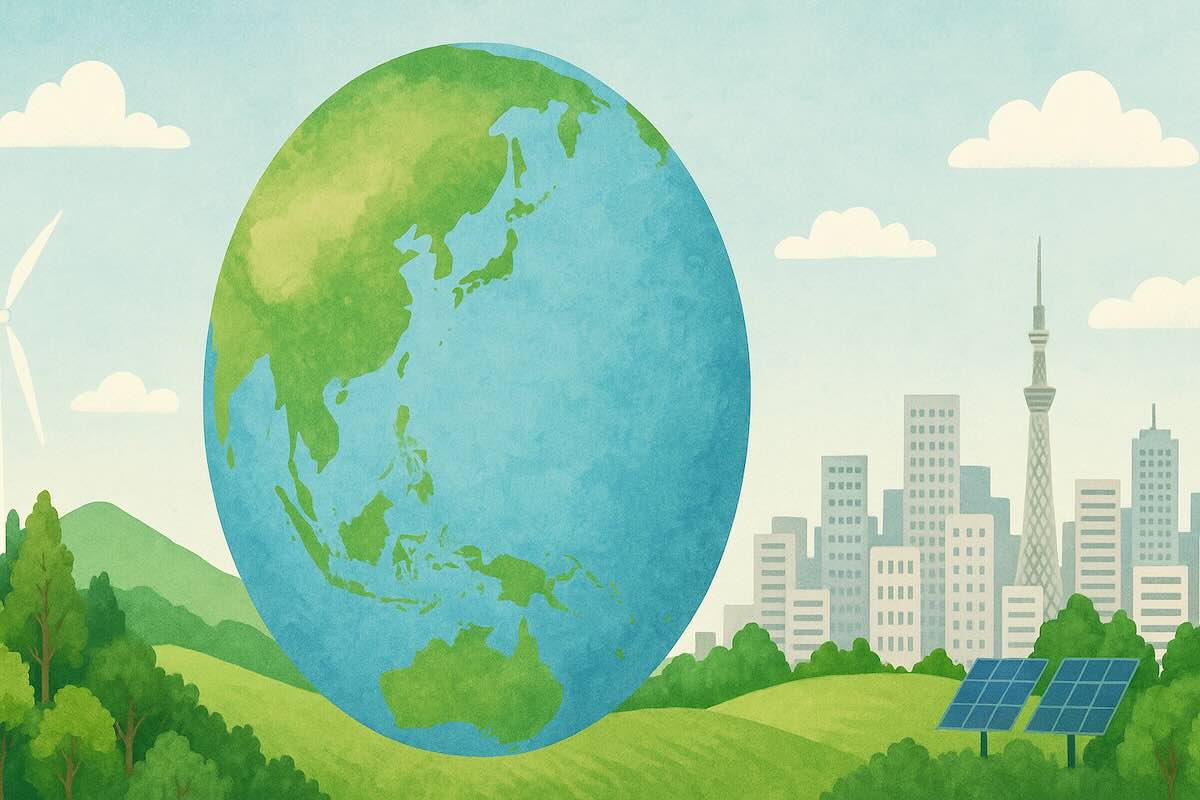
🌏 Seeing Is the First Step Toward Change
Decarbonization isn’t just a global goal — it’s a local, everyday effort.
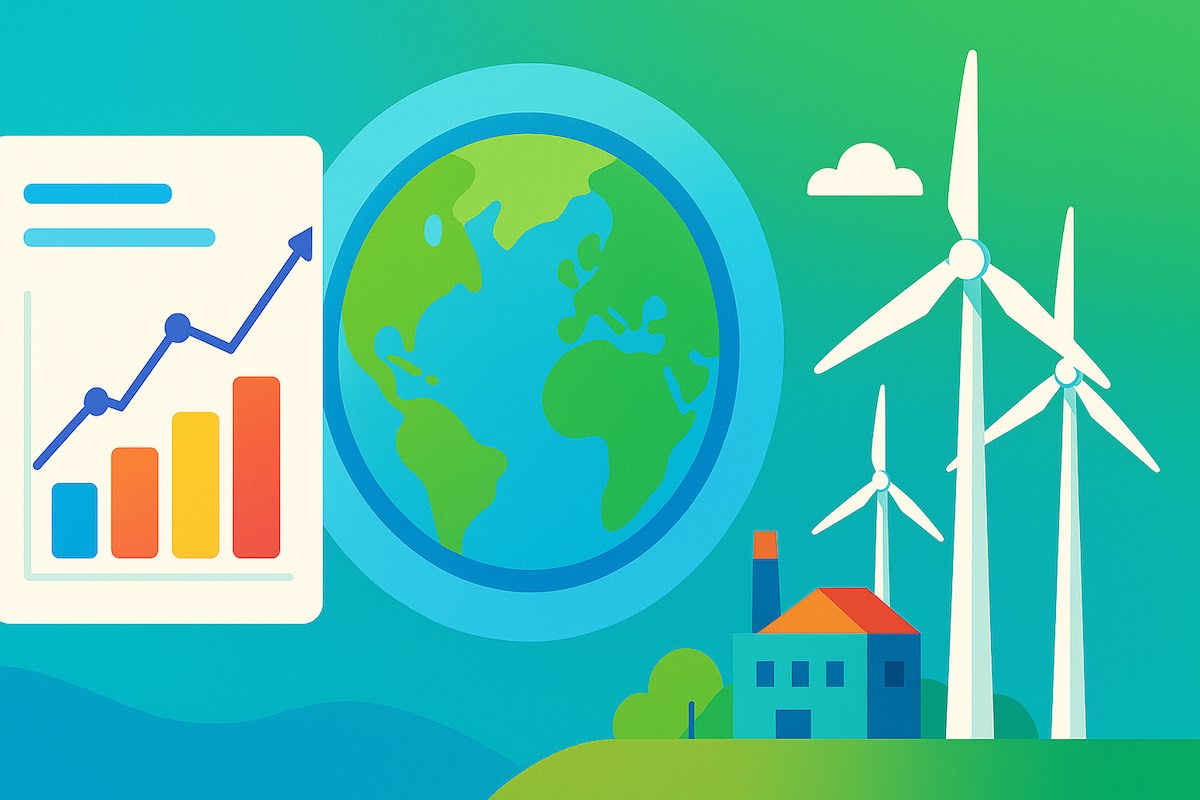
By visualizing energy use, you can identify waste, take action, and inspire a culture of continuous improvement.
When energy data becomes visible, awareness grows.
When awareness grows, action follows.
And that collective action — one small step at a time — shapes a more sustainable future for everyone.
Episode 4: How Manufacturers Can Respond to Rising Electricity Costs — Practical Energy Strategies in an Era of Price Volatility
“Visualization” Is the Key to Decarbonization — How to Start Energy DX

Humans and AI: The Future of Smart Factories
Japan’s Path Toward Decarbonization
Episode 1: Building Data-Driven Teams for the Energy DX Era